

Last updated: October 2026
Written by Emma for Savvy Cash Flow.
To read a crypto price chart, start with the daily chart, read each candle for open, high, low, and close, mark the trend, mark support and resistance zones, check volume, and use one trend tool and one momentum tool before you judge a move. A crypto price chart is a time-based record of traded prices for one crypto asset, and each candle on the chart shows what buyers and sellers agreed during one set period. This guide covers chart types, candlesticks, trends, support and resistance zones, volume, moving averages, the Relative Strength Index (RSI), 4 beginner candlestick patterns, a 7-step reading routine, and common beginner mistakes, and it ends with answers to common questions.
Key Takeaways
- A crypto price chart shows price over time, and a candlestick shows open, high, low, and close for one period.
- Start on the daily chart, then check the 4-hour chart, and use short timeframes only for timing after the larger trend is clear.
- Support is a price zone where buyers stepped in before, and resistance is a price zone where sellers stepped in before.
- Volume confirms a move when volume rises with the move, and low volume weakens the same move.
- Use 2 tools at most at first: one moving average for trend and RSI for momentum, and keep price action first.
- A chart shows past price action only, and a chart never guarantees a future price move.
Table of Contents
- What Is a Crypto Price Chart?
- How Do You Read One Candlestick?
- Line, Bar, and Candlestick Charts: Which Chart Type Fits Beginners?
- How Do You Spot a Trend on a Crypto Price Chart?
- What Are Support and Resistance Zones?
- How Does Volume Confirm a Price Move?
- What Do Moving Averages and RSI Show?
- Which 4 Candlestick Patterns Should Beginners Learn First?
- How Do You Read a Crypto Price Chart in 7 Steps?
- What Mistakes Do Beginners Make When Reading Crypto Charts?
- Conclusion
- Frequently Asked Questions
What Is a Crypto Price Chart?
A crypto price chart is a visual record that plots the traded price of one crypto asset against time, with price on the vertical axis and time on the horizontal axis, and the chart lets a reader see direction, range, and turning points in one view. A crypto price chart shows each trade period as one point, one bar, or one candle, and most free chart tools show Bitcoin (BTC) and Ethereum (ETH) pairs against United States dollars (USD) or Tether (USDT). A crypto price chart differs from a stock chart in one practical way: crypto markets trade 24 hours a day, 7 days a week, with no market close, so a daily candle on a crypto price chart covers a full 24-hour period, including weekends.
Savvy Cash Flow covers crypto basics in plain steps, and the Cryptocurrency guides collect the related beginner guides in one place.
How Do You Read One Candlestick?
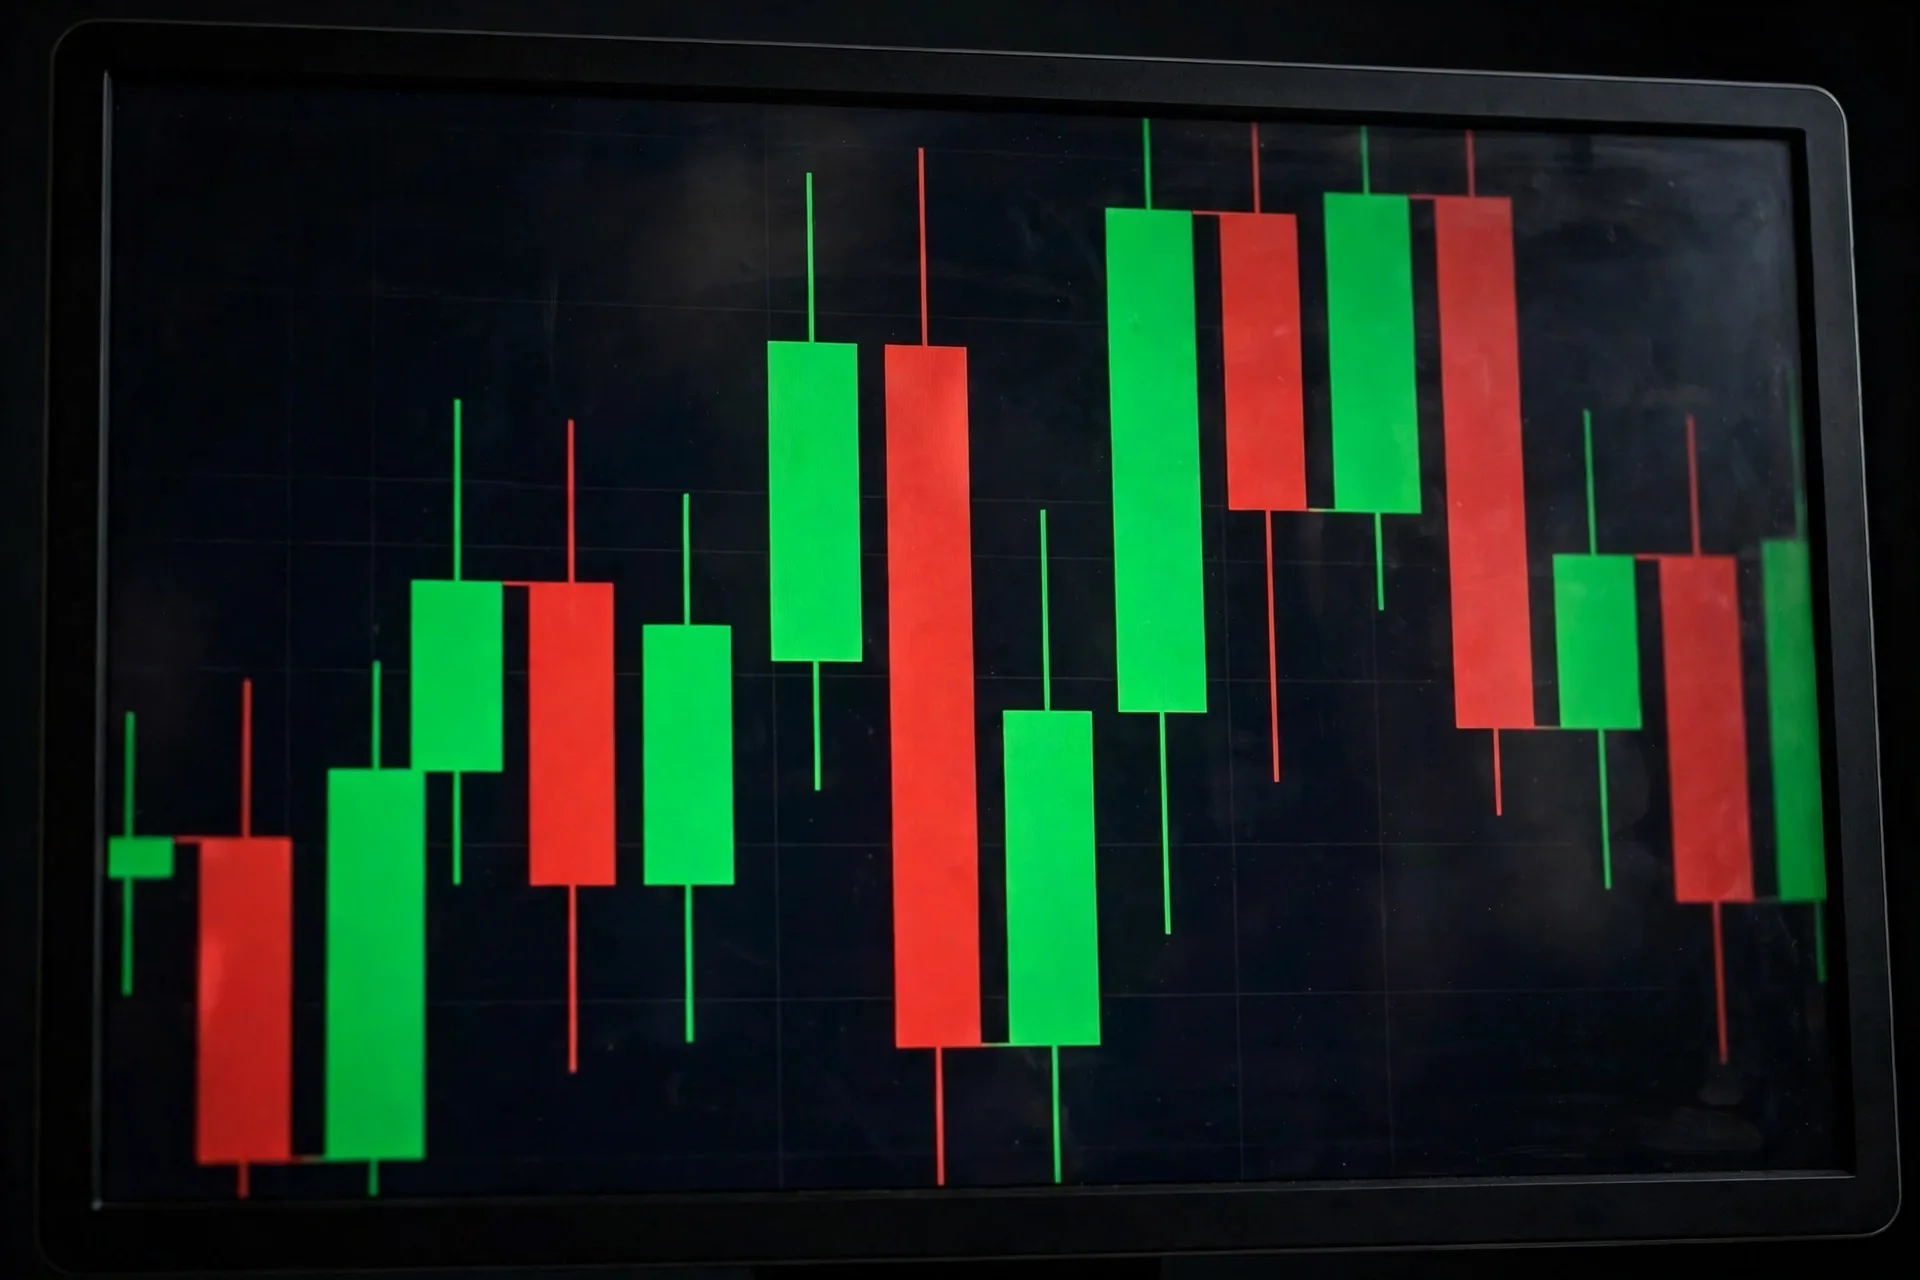
To read one candlestick, read the body for the open and the close, read the wicks for the high and the low, and read the color for the direction, because a green candle closed above the open and a red candle closed below the open. A candlestick packs 4 prices into one shape: open, high, low, and close, often shortened to OHLC. The thick body spans the open and the close, the thin upper wick reaches the high, and the thin lower wick reaches the low. A long body shows a large move between open and close, a long upper wick shows price fell back from a high before the close, and a long lower wick shows price rose back from a low before the close.
A single candle gives limited proof on its own, and a reader gains more proof from a run of candles near a support or resistance zone. The candlestick chart guide on Wikipedia gives the history and the body and wick definitions in full. A first-hand observation helps here: when I first opened a daily Bitcoin chart, I spent 10 minutes on one candle before I noticed that the wick, not the body, held the high for that day, and that one check changed how I read every candle after that day.
Line, Bar, and Candlestick Charts: Which Chart Type Fits Beginners?
A line chart fits a first look at direction, a candlestick chart fits a full read of price action, and a bar chart fits a reader who wants OHLC data in a compact bar form, so beginners gain the most from a line chart first and a candlestick chart second. A line chart joins closing prices with one line and hides the high, the low, and the open for each period. A bar chart shows OHLC data with one vertical bar per period, and a candlestick chart shows the same OHLC data with color and body size, which makes the open to close move easy to scan.
| Chart type | What the chart shows | Best beginner use |
|---|---|---|
| Line chart | Closing prices only | Direction at a glance |
| Bar chart | Open, high, low, and close | OHLC detail in compact form |
| Candlestick chart | Open, high, low, and close with color | Full price action and momentum |
A beginner can switch chart types on most free chart tools with one menu click while keeping the same timeframe.
How Do You Spot a Trend on a Crypto Price Chart?
To spot a trend on a crypto price chart, compare swing highs and swing lows across at least 10 candles, because an uptrend makes higher highs and higher lows, a downtrend makes lower highs and lower lows, and a range moves sideways between 2 zones. A swing high is a local peak where price turned down, and a swing low is a local dip where price turned up. A trendline joins swing lows in an uptrend and joins swing highs in a downtrend, and a trendline gains weight when price touches the trendline 3 times or more. A beginner reads the trend before adding any indicator, because an indicator reading means one thing in an uptrend and a different thing in a downtrend, and a trend check on the daily chart gives the main direction.

What Are Support and Resistance Zones?
Support is a price zone where buyers stepped in before and stopped a fall, resistance is a price zone where sellers stepped in before and stopped a rise, and support and resistance zones work best as wide zones, not as single exact prices. A reader marks support and resistance zones by looking left on the chart and finding price areas with repeated bounces, stalls, or sharp turns, and a zone with 3 touches carries more weight than a zone with one touch. A broken resistance zone often turns into a new support zone, and a broken support zone often turns into a new resistance zone, because buyers and sellers change roles after a break. A reader checks how price acts at a zone: a bounce with rising volume shows buyers defending the zone, and a clean break through the zone with rising volume shows the zone failed.
A support and resistance check pairs well with a What Is Bitcoin? read, because Bitcoin price zones shape how smaller crypto assets move.
How Does Volume Confirm a Price Move?
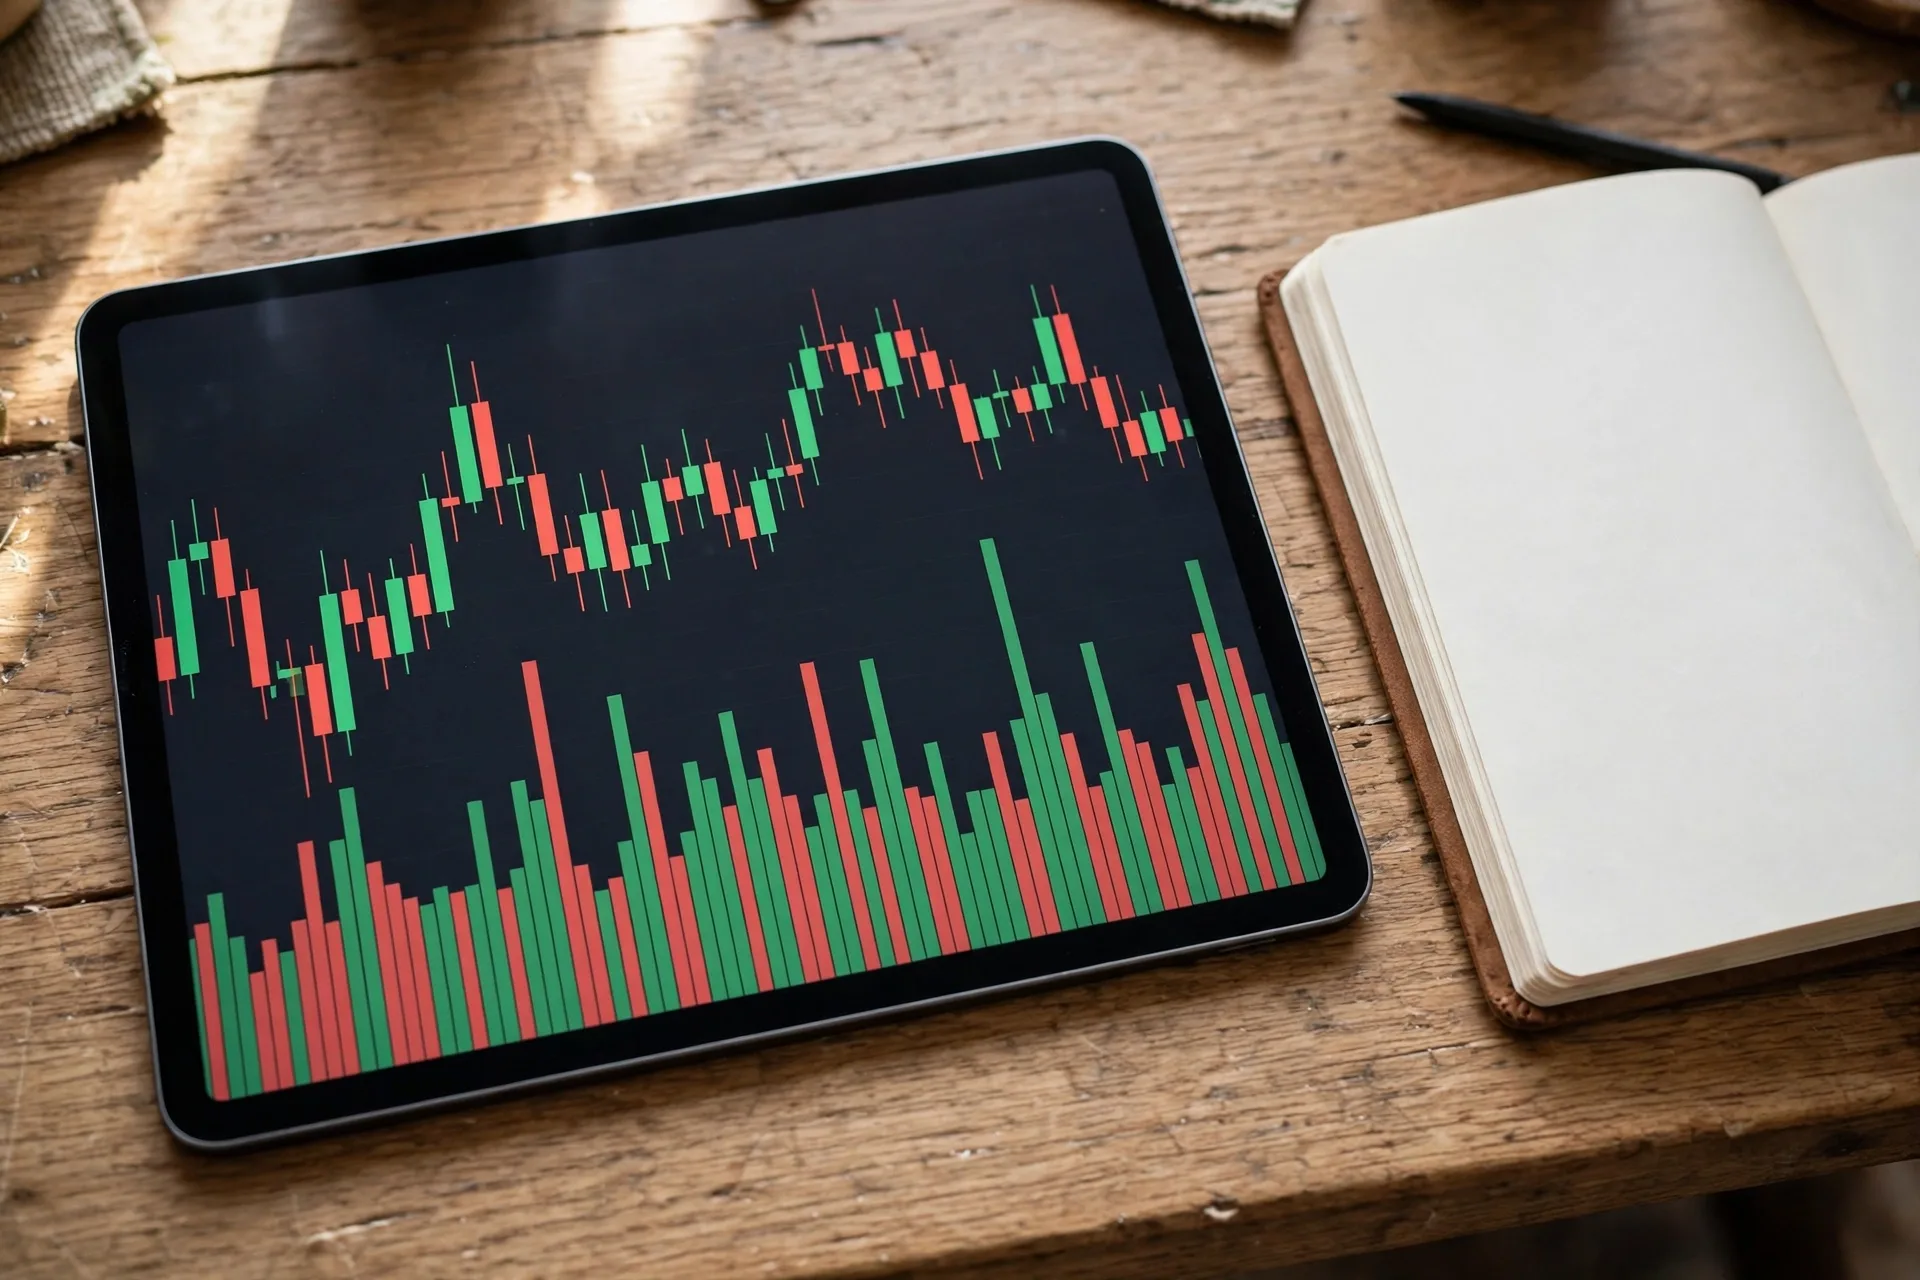
Volume confirms a price move when trading activity rises as price moves, because high volume shows broad participation in the move, and low volume shows weak participation in the same move. Volume is the total amount of a crypto asset traded during one period, and volume bars sit below the price candles on most charts. A breakout above resistance with rising volume carries more weight than the same breakout with flat volume, and a price rise on falling volume shows fading buying interest. A volume check compares current volume with the average volume of the past 20 periods on the same timeframe.
What Do Moving Averages and RSI Show?
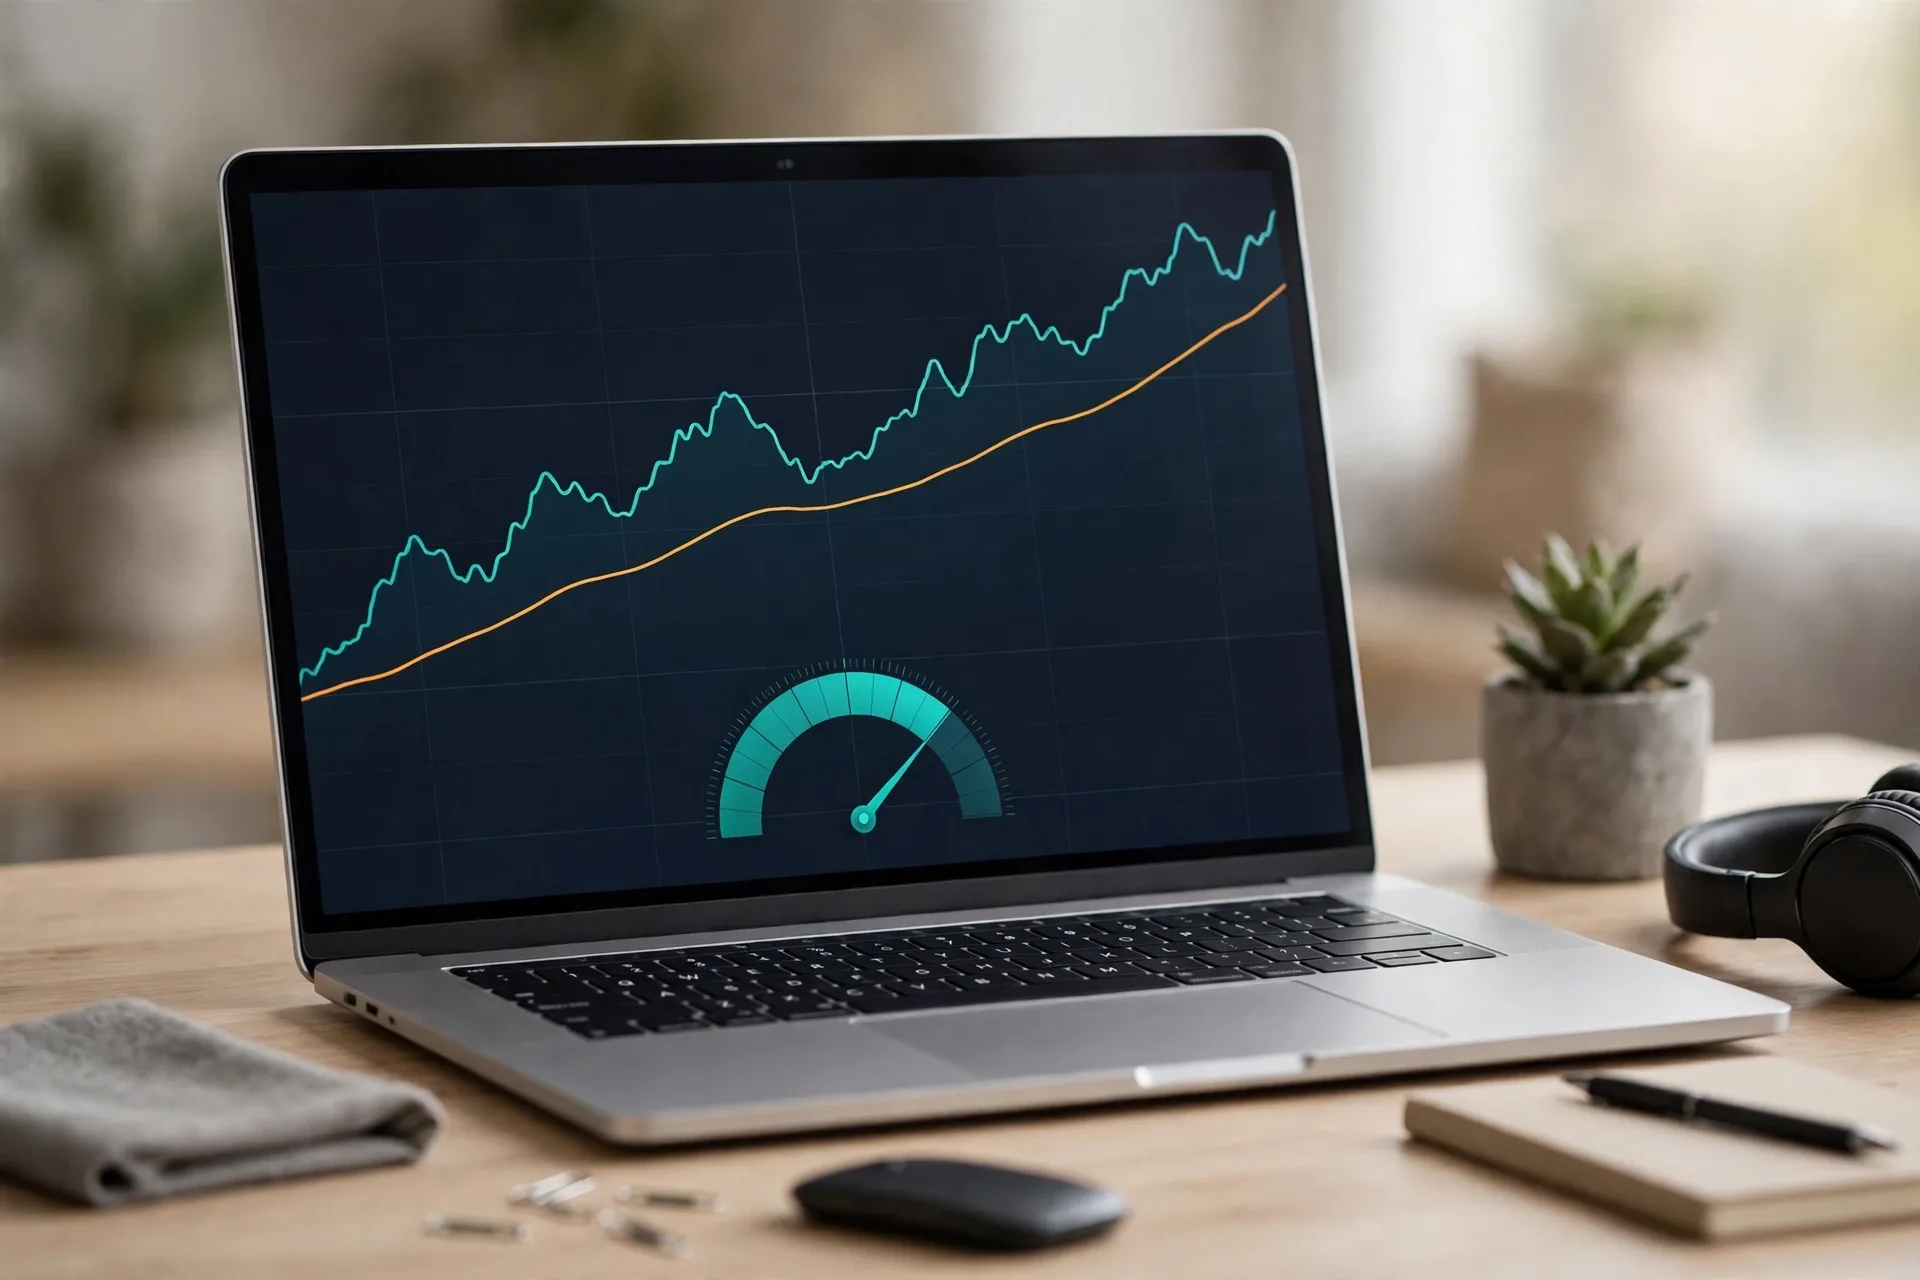
A moving average shows trend direction by smoothing past prices into one line, and RSI shows momentum on a 0 to 100 scale, so a moving average answers the trend question and RSI answers the stretch question for the same chart. A moving average (MA) adds past closing prices and divides the sum by the number of periods. A 50-period moving average shows the medium-term trend, a 200-period moving average shows the long-term trend, price above both lines points to an upward bias, and price below both lines points to a downward bias. RSI stands for Relative Strength Index (RSI), RSI measures how fast price rose or fell over the past 14 periods by default, RSI above 70 signals an overbought stretch, and RSI below 30 signals an oversold stretch. An overbought RSI reading never proves a fall ahead, because a strong trend can hold RSI above 70 for many candles.
| Tool | What the tool shows | Beginner setting | How a beginner reads the tool |
|---|---|---|---|
| 50-period moving average | Medium-term trend | 50 periods on the daily chart | Price above the line points up, price below the line points down |
| 200-period moving average | Long-term trend | 200 periods on the daily chart | Price above the line points up, price below the line points down |
| RSI | Momentum stretch | 14 periods, levels at 30 and 70 | Above 70 is stretched up, below 30 is stretched down, near 50 is neutral |
Which 4 Candlestick Patterns Should Beginners Learn First?
Beginners gain the most from 4 candlestick patterns: doji, hammer, shooting star, and engulfing, because each pattern gives a clear shape, a clear location rule, and a clear volume check, and each pattern fails often without that location and volume check. A doji has a tiny body, with open and close close together, and a doji signals indecision for that period, with more weight at support after a fall than in the middle of a sideways range. A hammer has a small body near the top of the range and a long lower wick, and a hammer signals that sellers pushed price down and buyers pushed price back up before the close. A shooting star has a small body near the bottom of the range and a long upper wick, and a shooting star signals that buyers pushed price up and sellers pushed price back down before the close. An engulfing candle has a body that fully covers the prior candle body, a bullish engulfing candle shows buyers taking over after a red candle, and a bearish engulfing candle shows sellers taking over after a green candle.
Learn how to buy your first crypto safely before you act on any chart pattern, because chart reading is a study skill, and safe buying steps protect funds while the study continues: Learn how to buy your first crypto safely

How Do You Read a Crypto Price Chart in 7 Steps?
To read a crypto price chart in 7 steps, open the daily chart, name the trend, mark support and resistance zones, read the last 10 candles, check volume, check one moving average and RSI, and write a one-line plan before you act. A 7-step routine keeps a beginner from jumping to one candle or one indicator, and a 7-step routine takes about 10 minutes on one chart once the steps feel familiar.
- Open the daily chart for the crypto asset and the pair you follow.
- Name the trend from swing highs and swing lows across at least 10 candles.
- Mark 2 support zones below price and 2 resistance zones above price.
- Read the last 10 candles for body size, wick length, and color runs.
- Compare current volume with the 20-period average volume on the same chart.
- Check price against the 50-period moving average and read RSI on the 14-period setting.
- Write one line that states trend, nearest zone, volume state, and the action you will take or avoid.
A beginner repeats the 7 steps on the same asset for 14 days, and a beginner compares each new daily candle with the written line from the prior day.
What Mistakes Do Beginners Make When Reading Crypto Charts?
Beginners make 5 common mistakes when reading crypto charts: reading one candle alone, trading against the daily trend on a 1-minute chart, marking exact lines instead of zones, adding too many indicators, and treating a pattern as a promise. A single candle gives 4 prices for one period, and a single candle never proves a trend change on its own. A 1-minute chart shows fast moves and heavy chop, and a 1-minute chart hides the daily trend that sets the main direction. A chart with 5 indicators hides price action and gives conflicting signals on most days, and a doji, a hammer, or an engulfing candle signals a possible turn without guaranteeing that turn. The hot vs cold crypto wallets guide sets out the storage choice for long-term holdings in plain terms. A chart check also needs a risk rule outside the chart: a planned exit and a loss limit set before any trade.

Conclusion
To read a crypto price chart well, a beginner reads candles for OHLC data, names the trend from swing structure, marks support and resistance zones, checks volume, and uses one moving average plus RSI, and that routine turns a busy chart into a clear read. Start with the daily Bitcoin chart, mark 2 zones, and write one line per day, and keep the routine short, written, and repeatable. Savvy Cash Flow publishes beginner crypto guides in the same plain style, and a reader who wants the next step can follow the category guides and the safe buying steps linked in this guide. This guide gives general education only, and this guide never gives financial advice for any reader.
Frequently Asked Questions
What is the best chart type for a beginner learning how to read a crypto price chart?
A candlestick chart is the best chart type for a beginner, because a candlestick chart shows open, high, low, and close in one shape, and a candlestick chart makes direction and momentum easy to scan. A line chart still helps for a first look at direction.
What timeframe should a beginner use first?
A beginner should use the daily chart first, with the 4-hour chart second, because daily candles show clear structure with less chop than short timeframes. A 1-hour chart helps with timing after the daily trend is clear.
What does a long wick on a candle mean?
A long upper wick means price reached a high level and fell back before the close, and a long lower wick means price reached a low level and rose back before the close. A long wick signals rejection at that extreme, and a long wick gains weight when the wick sits at a support or resistance zone.
Is RSI above 70 a sell signal on its own?
No, RSI above 70 is not a sell signal on its own, because RSI above 70 signals a stretched upward move, and a strong uptrend can hold RSI above 70 for many candles. A reader pairs RSI with trend, zones, and volume before judging a stretched move, and a reader never acts on one RSI reading alone.
Can you read a crypto price chart without indicators?
Yes, a reader can read a crypto price chart without indicators, because price action, trend, support and resistance zones, and volume give a full basic read on their own. Indicators add confirmation after that basic read, and indicators never replace trend, zones, and volume as the first checks.
How long does it take to learn how to read a crypto price chart?
A beginner can read basic candles, trends, and zones within 2 to 4 weeks of daily practice, because 10 minutes a day on one daily chart builds pattern sense through repetition. Full skill takes months of practice across trends, ranges, and breakouts.